
LogisticsWeb application · Internal platform · API/backend
Supply-chain analytics platform replacing no-code dashboards
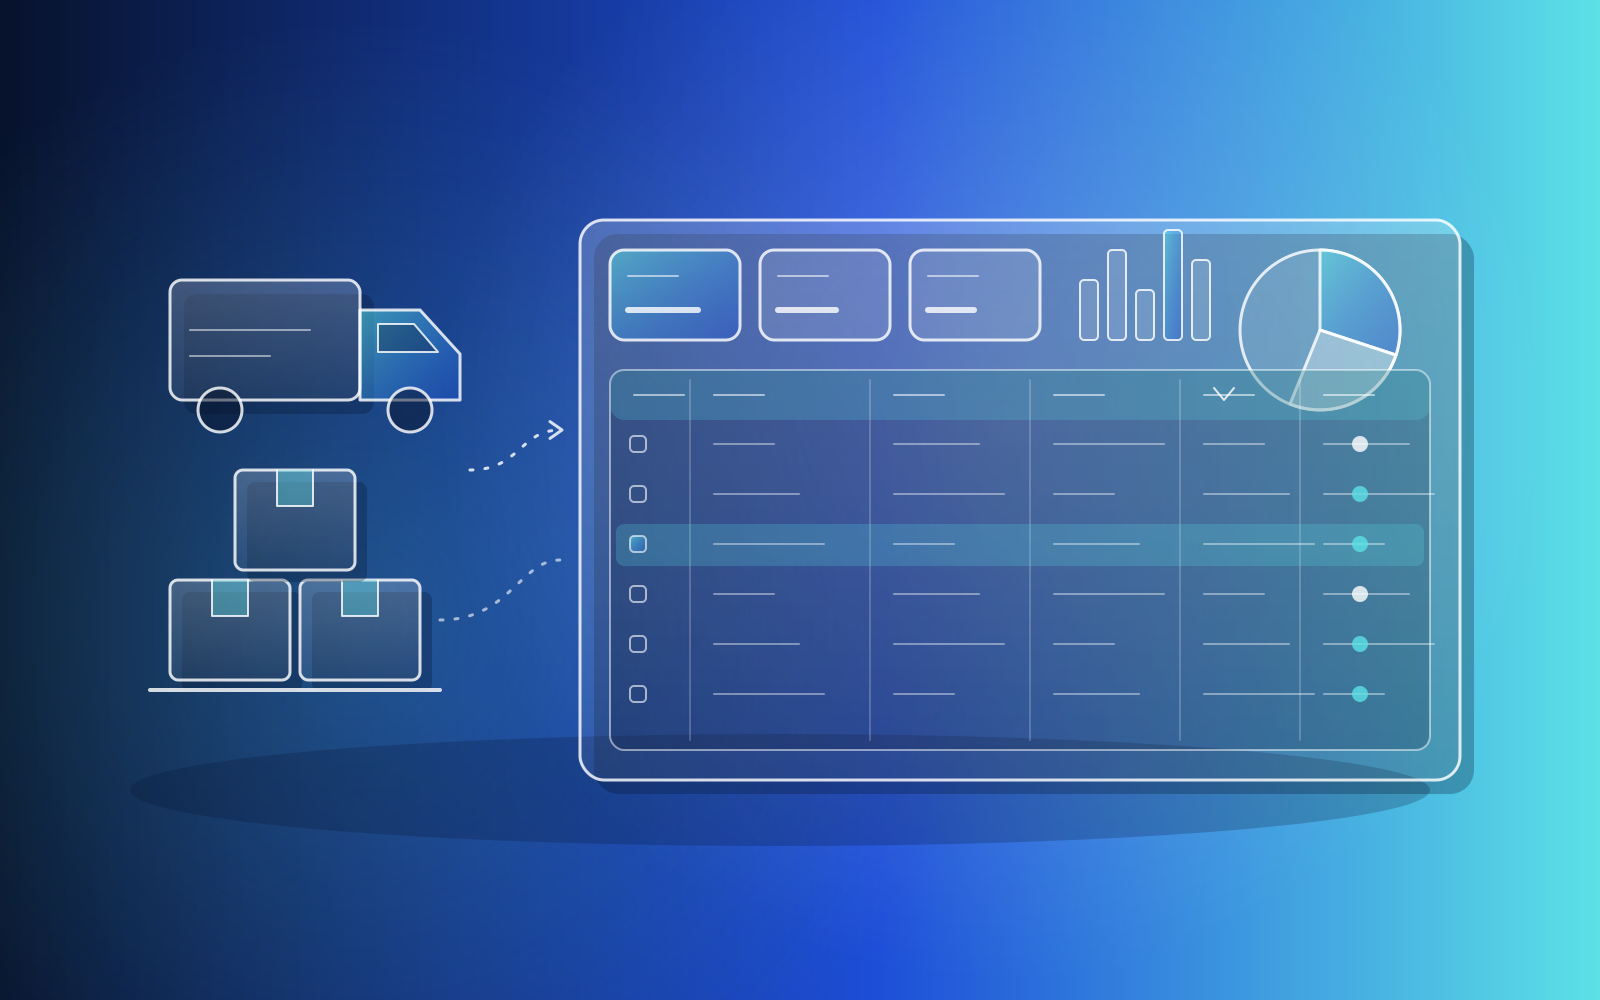
We replaced a manufacturer's no-code supply-chain dashboards with a custom React and Node.js analytics platform over its live SQL Server data. It adds role-based access, cross-site reconciliation, open-order and inventory modules, and data-dense tables with filtering and CSV export.
Problem
The client's supply-chain reporting ran on no-code apps over its Azure SQL databases that were view-only, slow, hard to secure per user and impossible to extend, and the two sites' systems disagreed about what was outstanding.
Key features
- Login, sign-up and tokenised password reset
- Role-based access gating routes and app visibility per site role
- Super-admin user management console
- Cross-site reconciliation page with drill-down tabs, KPI cards and status pie chart
- Live supply data with on-hand and months-of-supply charts and ship analysis
- Site-specific, all and past-due open-order pages
- Purchasing / live raw inventory module with stock balance tiles
- Multi-select location and purchaser filters
- Table toolkit: search, column-operator filters, sorting, show/hide, density, 25/50/100 pagination
- CSV export honouring hidden columns
- Composite unique keys for stable row selection
Tech stack
- Azure SQL
- DronaHQ
- Express
- Figma
- MUI
- MUI X DataGrid
- Mailtrap
- Microsoft SQL Server
- MongoDB
- Node.js
- React
- Redis
- Redux
- Tailwind CSS
- TypeScript
- Vercel
- hashed passwords
Services behind this project
Read more
 22SEP
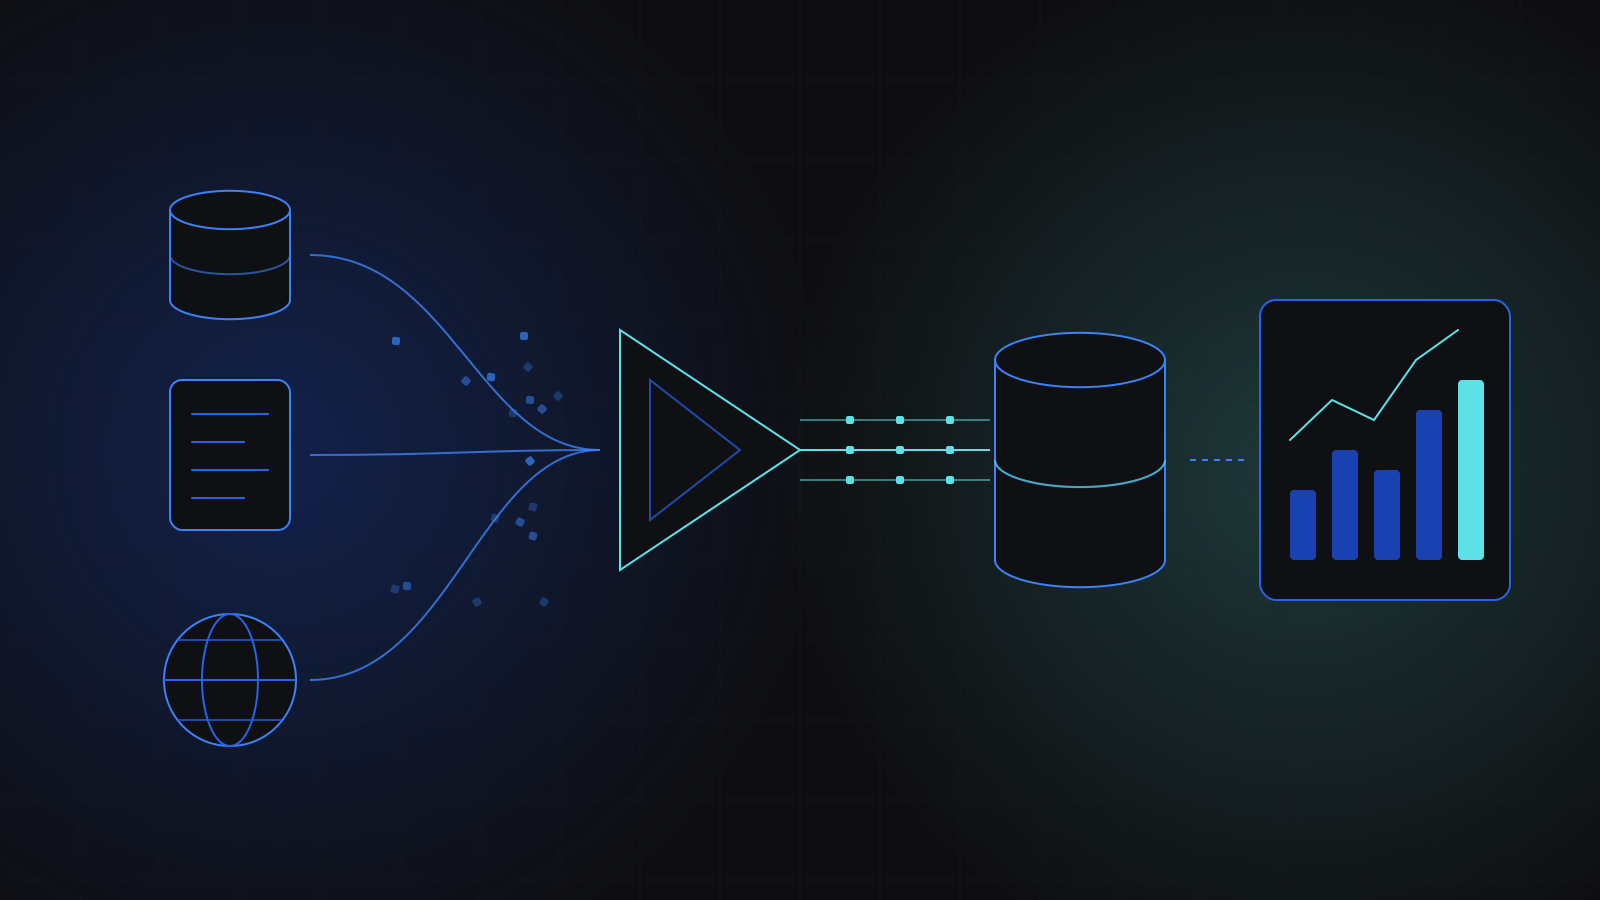
22SEPWhat is an ETL pipeline and when does your business need one?
What is an ETL pipeline, and when does your business need one? A guide to extract, transform and load, the warning signs, and what reliable ones look like.
Engineering5 min read