
OtherWeb application · Automation
Automated industry statistics dashboard
For a Canadian industry association we built a statistics dashboard that scrapes sector figures from public sources on a schedule, with fallback data and failure alerts so it never goes blank, and migrated its certification map tool to a rebranded, bilingual, mobile-friendly site.

Problem
The association's sector statistics were spread across unrelated public sources with different page structures, and its ageing certification-map site needed to move under its own brand and domain.
Solution
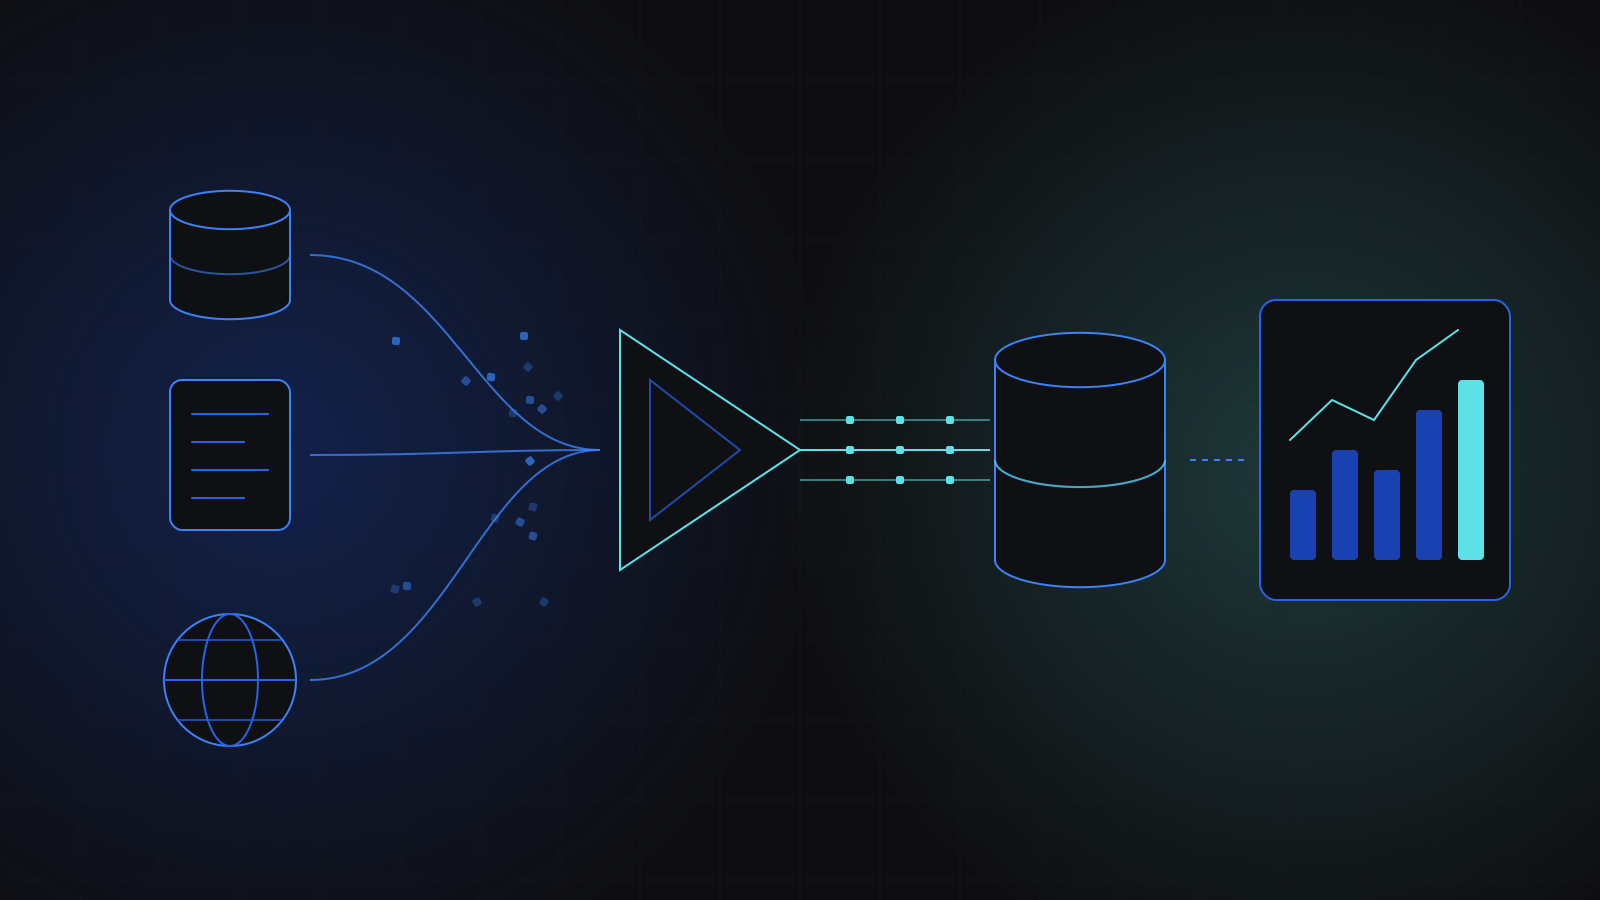
The team evaluated several scraping tools, then wrote lightweight per-source extraction with Axios, run by a Netlify scheduled function that writes a JSON/CSV dataset and refreshes an embeddable Next.js dashboard. A fallback layer keeps last-known values on screen when a source breaks, and email alerts name the failed source. In parallel the WordPress map tool was rebranded, made responsive and bilingual, with conditional content by map level, and released through staging with client sign-off.
Key features
- Per-source scraping for GDP, jobs, exports, production and rail loadings
- Scheduled cron refresh with last-scraped timestamp
- Fallback data so the dashboard never shows empty states
- Email failure alerts naming the failed source
- Embeddable Next.js dashboard
- WordPress map site rebrand with rebuilt header, footer and navigation
- English and French toggle and copy
- Conditional content across national, provincial and tenure map levels
- Mobile responsive fixes and two-column text layout fix
- README and environment template for handover
Tech stack
- Axios
- BeautifulSoup
- CSV
- GitHub
- JSON
- Netlify
- Netlify scheduled functions
- Next.js
- Node.js
- Nodemailer
- PHP
- Puppeteer
- Selenium
- Supabase
- WordPress
Services behind this project
Read more
 22SEP
22SEPWhat is an ETL pipeline and when does your business need one?
What is an ETL pipeline, and when does your business need one? A guide to extract, transform and load, the warning signs, and what reliable ones look like.
Engineering5 min read